HTML export: Rules and restrictions
Some of the IBM SPSS Visualization chart engine features are tailored for the HTML Export component. The HTML Export rules and restrictions are listed below.
Template source variable definitions
The basic ViZml specification, documented on the IBM SPSS Statistics product site, is typically used for creating charts, but is not compatible when creating custom chart templates. The basic ViZml specification defines the source variables in a specified data source. The template and variable elements that are used to define the required source variables are not documented on the IBM SPSS Statistics product site.
The required HTML Export template variable definitions are provided below:
<?xml version="1.0" encoding="UTF-8"?>
<visualization id="visualization1" style="visualizationStyle" version="2.8">
<extension>
<template aggregates="true" inst="http://www.w3.org/2001/XMLSchema-instance" location="http://xml.spss.com/visualization
http://xml.spss.com/visualization/vizml-2.8.xsd" url="http://xml.spss.com/visualization" version="1">
<name xml:lang="en">Heat Map</name>
<description xml:lang="en"/>
<variable type="categorical">
<name xml:lang="en">X</name>
</variable>
<variable type="categorical">
<name xml:lang="en">Color</name>
<description xml:lang="en"/>
</variable>
<variable type="continuous">
<name xml:lang="en">Y</name>
</variable>
<variable type="categorical">
<name xml:lang="en">Label</name>
<description xml:lang="en"/>
</variable>
<image/>
</template>
</extension>
......
Basic data variables use in the HTML Export component
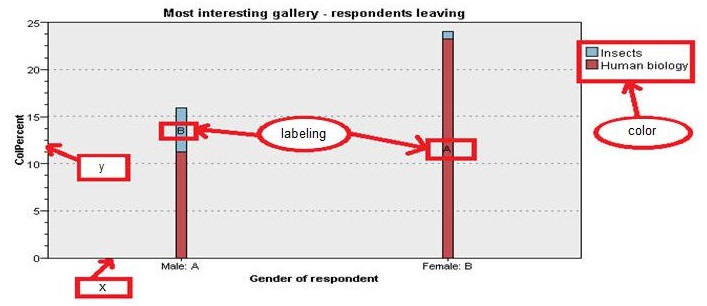
Specifying the chart types (bars, points, lines, areas, polygon and so on) is typically the first chart creation step. The next step is to specify the data variables for the specified chart type sub-elements (x, y, z, color, labeling, dash, and so on). The x, y, color, and labeling elements (which need to refer to a data variable) are the only chart type sub-elements available in HTML Export component. The following illustration provides an example for each supported sub-element:
Supported sub-elements
Labeling sub-element special usage
In the HTML Export component, the labeling sub-element is only used for displaying the column statistic value. The labeling only displays when:
▪The column proportions statistic is added to the table in UNICOM Intelligence Reporter.
▪Display column statistics results is selected in the UNICOM Intelligence Reporter File > Export > Tables > Advanced HTML Export Properties dialog (clicking the Advanced in the Exports Tables dialog displays the Advanced HTML Export Properties dialog).
Other tailored nViZml elements
The following nViZml elements are not supported by the HTML Export component:
▪facet related elements (faceting, alternating, intersect, intersectWhere, dot, elementVariableReference, cross, reflectionTransform, and so on).
▪z element (three dimensional charts)
▪animation related elements (animation, brushing, dragElement, drillDown, popup, swingController and so on)
▪multiple language supported elements (alternateLabel)
▪elements that require a specific data source or source variable/category (booleanMapping, categories, categories2, colorMapping, databaseSource, aggregate, delimitedFileSource, embeddedSource, expressionVariable, integerMappingsetMetaData, userSource, and so on)
▪footnote related elements (footnotes)
▪graphic operator related elements (nest)
▪boxplot related elements (schema).
See also