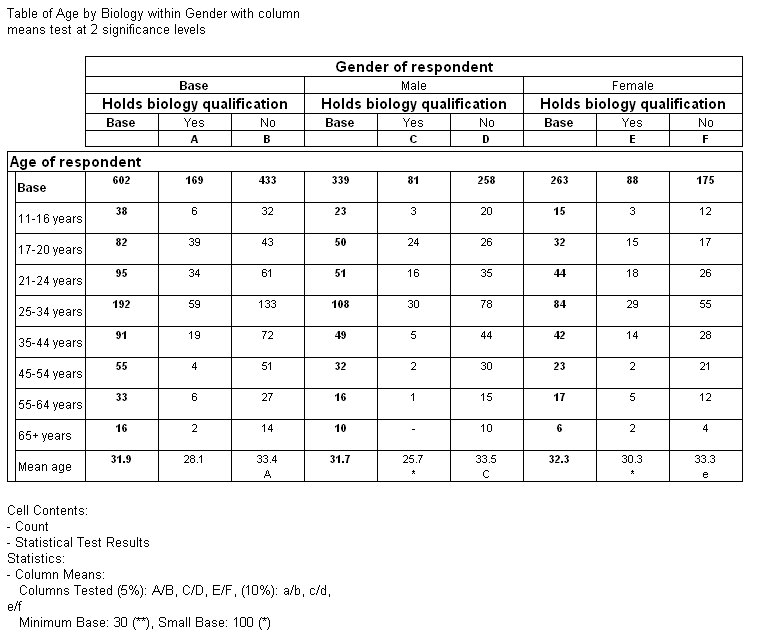
Example of testing at two significance levels
In the next example, two levels of significance have been specified, to test the same table both at the 5% (higher) and the 10% (lower) level.
Table showing column means test at 2 levels of significance
Note that in addition to the IDs assigned to the cells in the previous example, in the third set of Yes and No columns in the table, relating to the female respondents, there is now a lowercase e in the No column. This indicates that the mean age of the respondents in this column is higher than the mean age of the respondents in the Yes column and that the difference is statistically significant at the 10% level.
These lines of script add the two significance levels to the test:
TableDoc.Table5.Statistics.Add("ColumnMeans")
' Set the higher significance level
TableDoc.Table5.Statistics.ColumnMeans.SigLevel = 5
' Set the lower significance level
TableDoc.Table5.Statistics.ColumnMeans.SigLevelLow = 10
See also

