Examples of the column means test
Sample script file: QuanvertTables.mrs
This example script is based on the Museum sample data set.
The column means test in this example tests whether there are any significant differences between:
▪The mean age of all respondents who do and do not have a biology qualification
▪The mean age of the male respondents who do and do not have a biology qualification
▪The mean age of the female respondents who do and do not have a biology qualification
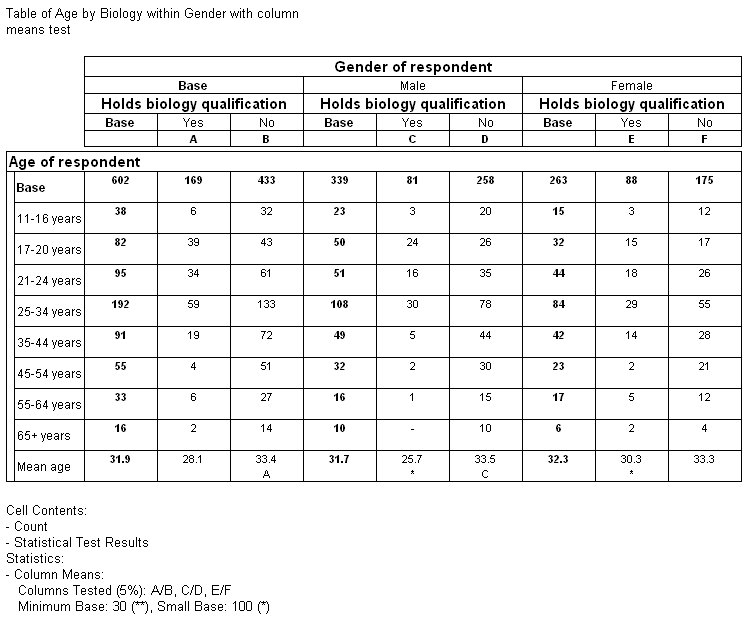
Table showing column means test
Note that UNICOM Intelligence Reporter has assigned IDs to all of the columns in the test. Because this is a nested table, the Yes and No columns formed from the categories of the child variable (biology) are repeated for each element of the parent variable (gender). UNICOM Intelligence Reporter performs the column means test separately for each set of columns formed from the categories of the biology variable. Notice how this is reflected in the footnote text.
The first set of Yes and No columns in the table (with IDs A and B respectively) are nested within the Base column of the gender parent variable. They therefore relate to all of the respondents, both male and female. The A below the cell contents in the Mean age row in the No column indicates that the mean age of the respondents in this column is higher than the mean age of the respondents in the Yes column and that the difference is statistically significant at the 5% significance level.
The second set of Yes and No columns in the table (with IDs C and D respectively) relate to the male respondents. The C in the No column also indicates that the mean age of the respondents in this column is higher than the mean age of the respondents in the Yes column and that the difference is statistically significant at the 5% significance level.
The third set of Yes and No columns in the table (with IDs E and F respectively) relate to the female respondents. UNICOM Intelligence Reporter has not displayed any IDs in the mean age row in these columns, because the difference in mean age is not statistically significant at the 5% significance level.
The column means test in this table shows us that the difference in mean age between the respondents who have and do not have a biology qualification is significant at the 5% significance level, but that this is only true for the male respondents and the whole sample. It is not true for the female respondents.
This example was created using the Museum UNICOM Intelligence Quanvert database, in which the age variable has a built-in mean element based on the raw age data. Here is the script to load the Museum data, create the table, and run the test:
Dim TableDoc
' Create the Table Document object
Set TableDoc = CreateObject("TOM.Document")
' Load the Museum sample .mdd file
TableDoc.DataSet.Load("Data\Quanvert\Museum\qvinfo", "mrQvDsc")
...
TableDoc.Tables.AddNew("Table3", "age * gender > biology{Base(), Yes, No}", _
"Table of Age by Biology within Gender with column means test")
' Remove the column percentages cell item and
' define the column means test
TableDoc.Table3.CellItems.Remove(1)
TableDoc.Table3.Statistics.Add("ColumnMeans")
See also