Example filter
Suppose you want to create a table of age by gender, but include only respondents who are over 16 years old. In the Museum data set, you would do this by creating a filter that excludes respondents who selected the 11-16 years category in response to the question on which the age variable is based. That is, respondents between the ages of 11 and 16 will not be counted.
Here is the table:
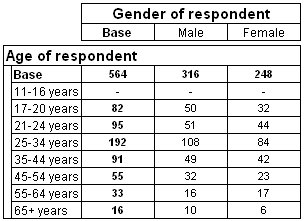
Table of age by gender, filtering out 11-16 year age group
Notice that there are no respondents in the
11-16 years row. Compare the values in the Base row with those in the Base row in the unfiltered table in the
Tables: you will see that the values in the
Base row in the filtered table have been reduced by the values that would have appeared in the
11-16 years row if no filter had been specified.
This example has been designed to illustrate the effect of using a filter.
Creating the filter
2 Select the Define tab.
3 In the Table Definition section, click the Edit Table Filter button.
This opens the Filter dialog box.
4 Optionally, enter a
Name and
Description for the filter. If you change the autogenerated name, make sure that the name you enter follows the rules for valid names. See
Naming conventions for more information.
5 In the Variable List, select the age variable.
Provided you are using the Museum data set, in which the age variable is defined as a categorical variable, the right side of the dialog box now displays a list of the age variable’s categories.
6 On the right side of the Filter dialog box, select the 11-16 years category.
7 Select None of the selected from the list.
8 Click OK.
This returns you to the Define tab, where you will see the description of the filter in the Table Filter text box in the Table Definition section.
9 Repopulate the table to see the effect of the filter.
See also