Sorting tables
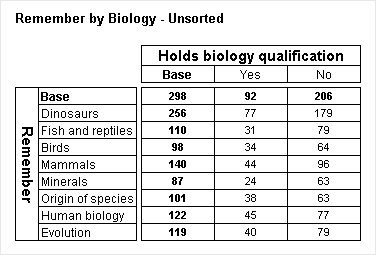
Sometimes it is useful to sort your tables, so that you can see at a glance which is the most important or popular response. Sorting tables is sometimes called ranking. To understand how it works, consider an unsorted table from the Museums sample data set, displaying What Respondents Remember by Holds Biology Qualification (some of the rows have been hidden to produce a shorter table for convenience; this does not affect the discussion in this topic):
Remember by Biology - unsorted
The rows and columns in the unsorted table are displayed in the order in which they are stored in the source data file. Suppose you want to sort the table so that the rows that contain more respondents appear before those containing fewer respondents. When you sort
rows, you need to select the
column on which you want to sort. For example, you could sort the rows by their values in the base column, by selecting
biology{Base} in the Sort rows based on list on the Sort tab in the Table Properties dialog. See
Sorting a table for more information.
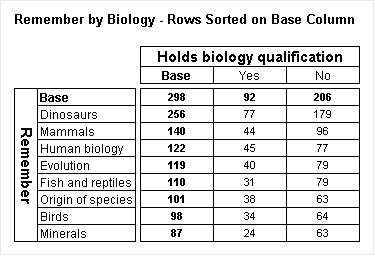
Here is the resulting table:
Remember by Biology - sorted on Base column
If you compare this table with the unsorted table, you will notice that the rows have been reordered, making it easy to see which categories were most popular. Although you generally want to sort the rows on the base column, you are not restricted to doing this. For example, you can sort the rows on the values in the Yes column, by selecting biology{Yes} in the Sort rows based on list.
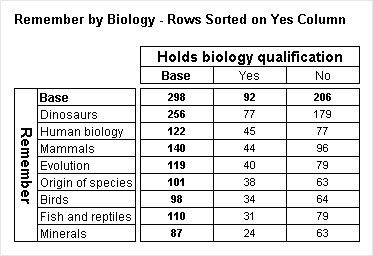
Here is the table:
Remember by Biology - sorted on Yes column
The order of the rows has changed to reflect the values in the Yes column.
You can sort the columns, just like you can sort the rows. When you sort columns, you need to specify the row on which you want to sort. For example, you can sort columns by their values in the base row by selecting remember{Base} in the Sort columns based on list.
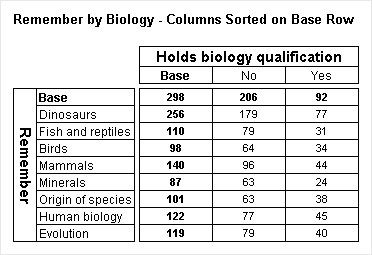
Here is the table:
Remember by Biology - sorted on Base row
The order of the Yes and No columns has been reversed, making it easy to see that more respondents chose the No category.
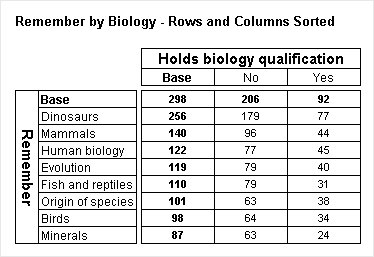
You can sort both rows and columns in the same table, by selecting remember{Base} in the Sort columns based on list and biology{Base} in the Sort rows based on list.
Here is the table:
Remember by Biology - sorted on base row and column
You can also sort tables on the first or last row or column in the table, without referring to a specific row or column name. This can be useful if you are running tracking studies to monitor change over time, as you can reuse the same table with each wave of data without having to re-select the row or column to sort on. For example, if you have a table containing monthly data, you can select Last column to sort the table by the latest month, rather than selecting the name of the month each time you update the data.
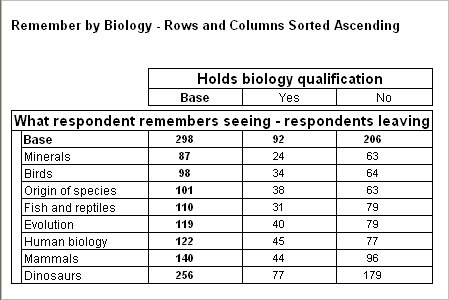
By default, sorting is carried out in descending order. To sort tables in ascending order, click ascending order. For example, here is the same table as the previous one, but sorted in ascending order:
Remember by Biology - sorted on base row and column in ascending order
All of the tables shown in this topic have only one item of cell contents; if the table contains more than one item of cell contents, the sort is based on the first item of cell contents. When creating sorted tables that contain more than one item of cell contents, you need to consider the order in which you specify the items.
Notes and general limitations
▪If there is more than one item of cell contents, the first item is always used for the sort.
▪Sorting rows that contain cumulative column percentages or columns that contain cumulative row percentages is not recommended, as the reordered percentage values do not give meaningful results.
▪The side or top of the table is not sorted if it contains a combination of nesting and concatenation (multiple added variables).
▪You cannot use an element that is inside a net to sort the other axis of the table.
▪You cannot sort an axis that contains net elements in an outer nest level. Any sorting that would apply is ignored.
▪There are a number of special rules that apply when sorting axes that contain special elements. See
Sorting special items for more information.
See also
