Working with profile tables
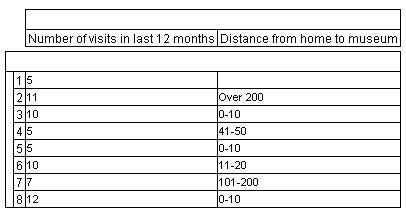
Profile tables display non-aggregated respondent data for selected variables. This is particularly useful for displaying information that is meaningful without being aggregated, such as text responses to an open-ended question. You can create profile tables from any type of variable, and you can add filters in the same way as for aggregated tables. For example, this profile table shows individual responses for the visits12 and distance variables, filtered to include only respondents with more than 4 visits in the last 12 months:
You can create profile tables using UNICOM Intelligence Reporter, export them to a number of different output formats, and save them in table document (.mtd) files. You can include both profile tables and aggregated tables in the same table document file. Profile tables can also be displayed and created in UNICOM Intelligence Reporter . Profile tables cannot be displayed in UNICOM Intelligence Reporter - Survey Tabulation; table document files containing a mixture of profile tables and aggregated tables can be opened in UNICOM Intelligence Reporter - Survey Tabulation 4.0, but all profile tables are ignored and only the aggregated tables are displayed.
This section provides information about how to create profile tables.
See also

