Statistical tests compared to Quantum and Quanvert
During the development of UNICOM Intelligence Reporter, the algorithms for statistical formulae were rewritten, and the revised formulae were reviewed by IBM Corp. statisticians. Although the formulae appear very different to those used in Quantum and Quanvert, tests have shown that they give comparable p values.
This section provides a comparison of the formulae in UNICOM Intelligence Reporter and Quantum/Quanvert.
Column proportions test
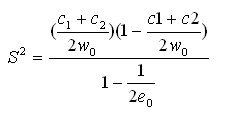
In the column proportions test, where the data are not overlapping, the denominator of t = sqrt(term), where term is
in UNICOM Intelligence Reporter:
in Quantum/Quanvert:
Where there is overlap, the denominator of t = sqrt(term), where term is
in UNICOM Intelligence Reporter:
in Quantum/Quanvert:
In some cases, slight differences will be seen in your results as borderline cases that are significant using the UNICOM Intelligence Reporter formula may not be significant using the Quantum/Quanvert formula.
Degrees of freedom
in UNICOM Intelligence Reporter:
DF = e 1 + e 2 - e 0 - 2
in Quantum/Quanvert:
DF = e 1 + e 2 - e 0 - 1
To reproduce the Quantum/Quanvert formula, do one of the following
▪use the property:
TOM.Statistics["ColumnProportions"].UseQFormula = True
▪use the Use Quantum/Quanvert column proportions formula option that is available from the popup box in the Statistics tab of the Table Properties dialog box.
For full details of the UNICOM Intelligence Reporter - Survey Tabulation formula, see
Statistical formula for the column proportions test. For full details of the UNICOM Intelligence Professional formula, see
Statistical formula for the column proportions test.
Column means test
Degrees of freedom:
in UNICOM Intelligence Reporter:
DF = e 1 + e 2 - e 0 - 2
in Quantum/Quanvert:
DF = e 1 + e 2 - e 0 - 1
To reproduce the Quantum/Quanvert formula, do one of the following:
▪use the property:
TOM.Statistics["ColumnProportions"].UseQFormula = True
▪use the Use Quantum/Quanvert column proportions formula option available from the popup box in the Statistics tab of the Table Properties dialog box.
For full details of the UNICOM Intelligence Reporter formula, see
Statistical formula for the column means test.
Paired preference test
In the paired preference test, the denominator of t = sqrt(term), where term is
in UNICOM Intelligence Reporter:
in Quantum/Quanvert:
where
For full details of Quantum and Quanvert formulae, see the Quantum User's Guide or the Quanvert User's Guide.
References
Kish, L. Survey Sampling. New York: John Wiley and Sons. ISBN 0-471-48900-X.
See also


