Element Properties dialog box
You use the Element Properties dialog box to edit an element’s properties.
To open the Element Properties dialog box, locating the required element on the Edit tab in the
Edit Variable dialog box: Edit tab, the New Variable dialog box (see
New Variable dialog box), or Edit Axis dialog box (see
Edit Axis dialog box), and then click
Properties on the menu at the top of the tab.
Name
You cannot change the element's name in this dialog box.
Label
This is the element's label, which is the text that is displayed in the row or column header when the element is on the side or top of a table. You cannot change the label in this dialog box.
Type
This shows the element's type. A category element is a standard category in a categorical variable. The other element types correspond to the special elements that you can insert. See
Insert Item dialog box for more information.
Calculate
For mean, sample variance, standard error, and standard deviation, this option enables you to choose whether the item is to be based on factors or a numeric variable, and if so, which one. For minimum, maximum, numeric, sum, median, mode, or percentile elements, use this option to select the numeric variable on which the element is based.
Factor
This option enables you to define a factor for a category or user-defined category, including combined categories and nets. A factor is a constant numerical value that can be assigned to a category in a categorical variable for use in statistical calculations. Factors are used when you want to base a summary statistic on the categories in a variable, rather than on a numeric variable. This is because statistics can be calculated on numeric data only and categories are not true numeric values. (Although the Data Model represents the responses to categorical questions as numeric values, these are in fact identifiers or codes and are not suitable for statistical analysis.)
Cut-off Value
When you add a percentile element, use this option to enter the cut-off value, for example, to add an element to display the 75th percentile, enter 75.
Example
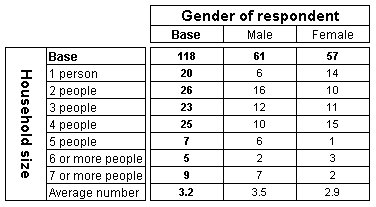
Here is a table of the hhsize by gender variables in the Short Drinks sample data. A factor of 1 has been assigned to the first category, a factor of 2 to the second category, etc. and a mean row has been added to show the mean factor value.
For an example that shows a mean calculated from a numeric variable, see the second example table in the Insert Item dialog box (see
Insert Item dialog box).
See also