Chris Gane and Trish Sarson introduced their ideas on systems analysis and design in the late 1970s. Their methodology remains today as one of the most popular techniques for structured analysis and design of systems.
The Gane & Sarson method is based on the building of a logical model of the system, using graphical techniques to enable users, analysts, and designers to get a clear and common picture of the system and how its parts fit together to meet the user’s needs.
The methodology involves building a system top-down by successive refinement. First, an overall system data flow is created. Then, detailed data flows are created. Next, the details of the data structures and the process logic is determined. Finally, design of modular structures is begun.
The focus of analysis in the Gane and Sarson method is the Data Flow diagram, which is used to describe the processes of the system, and how the processes transform data.
Gane and Sarson support
When you enable Gane and Sarson in the Configuration dialog box in System Architect (Tools, Customize Method Support), the following diagrams become available:
Data flow diagrams (DFD) are a means for creating system blueprints and communicating with clients and users. The creation of DFDs is an early step in the structured analysis approach to system analysis.
A DFD is a diagram that shows where the data come from, where they go, where they are stored, and what happens to them on the way. These four things are the only things that can happen to data. DFDs are a way of showing the overall picture of a system, and some of the detail.
In general, most process models of systems start with a context diagram, on which a Process symbol, some external entities, one or more data stores, and some data flows are pictured. The process symbol is traditionally labeled “The System,” or words to that effect. That symbol expands to a “Child” diagram which may have 5 to 9 process symbols, each of which can expand to a child diagram, and so on: see Creating a set of leveled diagrams.
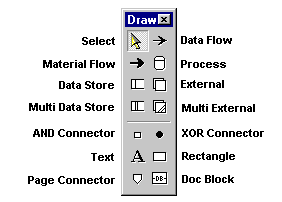
Toolbar buttons
The Data Flow, Gane and Sarson diagram provides the following draw toolbar to create data flow diagrams.