Adding summary statistics to a numeric variable
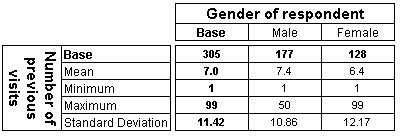
Sometimes you may want to show a summary statistic of the values in a numeric variable rather than grouping the values into bands. For example, you may want to show the base, minimum, maximum, and mean values, or the standard deviation. For example, the visits variable in the Museum sample data set is a numeric variable that stores the number of times respondents have visited the museum before. You can show a summary of the values in the variable, as shown in the following table:
Table showing visits by gender, with summary statistics mean, min, max and standard deviation
In practice you might want to mix both approaches: for example, show bands and the mean value. You would typically create your bands first, as shown in
Banding a numeric variable, then switch to the Edit tab and insert the statistics as described below. If you want to be able to use different approaches in different tables (for example, show bands in some tables and a summary in others) you would typically create a copy of the variable and set up the bands in one variable and the summary in the other. See
Copying a variable for more information.
These instructions describe how to create the summary statistics so that they appear in all tables. If you want the statistics to appear in a specific table, use the Edit Axis dialog box instead of the Edit Variable dialog box. The steps within the dialog box are the same. See
Edit Axis dialog box for more information.
To add summary statistics to a numeric variable
1 Select the Define tab.
2 In the Variable List, select the numeric variable.
3 From the menu, choose Variables > Edit.
This opens the Edit Variable dialog box: see
Edit Variable dialog box.
4 From the menu at the top of the Edit tab, choose Insert.
This opens the Insert Item dialog box (see
Insert Item dialog box).
5 In the list of Available Items, select the summary statistics you want to use. For example, select Minimum, Maximum, Mean, and Standard Deviation.
6 Click Add.
7 If necessary, use the Move Up and Move Down buttons to move the statistics into the required order.
8 Click OK.
This inserts the statistics into the list on the Edit tab.
9 Select the first statistic you inserted and from the menu at the top of the tab, choose
Properties. This opens the Element Properties dialog box
Element Properties dialog box.
10 In the Element Properties dialog box, select the numeric variable in the Calculate list.
11 Click OK.
12 Repeat these three steps for the other summary items you inserted.
13 Click OK.
Note The changes will be applied to any existing tables that include the variable next time you populate them, provided you have not used the Edit Axis dialog box (see
Edit Axis dialog box) to specify how the variable is to appear in any of those tables.
See also